Yifei Sun
· 547 words · 2 min readWe shouldn't worry about getting hacked - that's illegal.
I'm a MSCS student at Northeastern University. I have the fortune to be advised by Dr. Ji-Yong Shin at Systems Research Group. I visited Computing Software Group advised by Dr. Tomoharu Ugawa at University of Tokyo during the summer of 2024. I finished my undergrad at University of Utah under the guidance of Dr. Shad Roundy and co-advisor Dr. Tucker Hermans.
I'm generally interested in system and theory (CV), topics include:
- Verifications on consistency semantical constraints in distributed systems.
- Constructive type theory and mechanized proofs.
- Reproducible (build) system in HPC environments.
My contact info is hidden within the source code of this site. Search for the platform you want to reach me on in all lowercase (e.g. github, linkedin, etc.). You can reach me directly with Matrix, Discord (use my GitHub username), or email (echo -n 'eXN1bkBoZXkuY29tCg==' | base64 --decode).
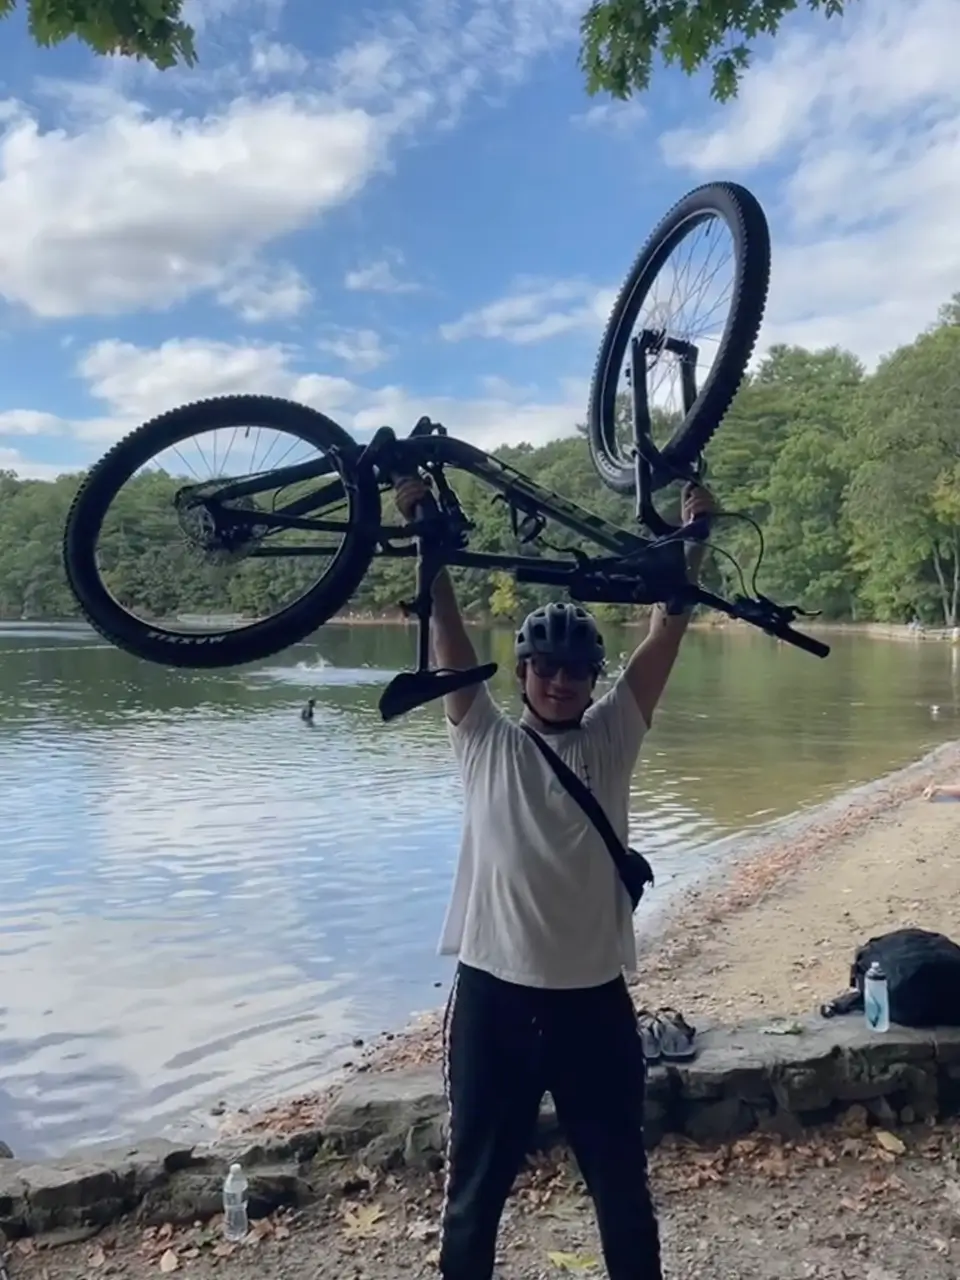
I ride a Trek Fuel EX 5 for fun and commute, and I daily-drive a Framework Laptop 13 with NixOS and a 14-inch MacBook Pro on the go. I own and operate AS10779 (PeeringDB, looking glass) with two IP assignments from ARIN. I maintain about 15 packages and actively contribute to the Nix ecosystem. During my free time, I enjoy swimming, cycling, archery, and playing osu! (mostly mania and std with Wacom Intuos Pro). Streaming services? Apple Music all the way (playlist)!
Troll: I can't stand s-expressions, but Emacs Lisp gets a free pass (cause it's actually useful). I dislike Racket so much that I even made a website and a poster about it.
Random recommendations (unordered):
- Paid search engine Kagi, you control the ranking
- NixOS for your next OS
- Self-hostable code search engine Zoekt
- Get an amateur radio license, my callsign is KC1VZR
- Email over radio with Winlink + Pat
- Tailscale, Headscale, or at least WireGuard
- Kanidm for OAuth/OIDC and read-only LDAP
- Learn OCaml with Dune
- Write a toy language?
- Learn how to mechanize proofs?
- Static site generator Lume + Cloudflare Pages
- Cobalt, yet another FFmpeg wrapper, but nice